
RETIREMENT
Done YOUR Way
Confidence in your future starts
with a plan built around YOU
National Fiduciary Advisory Firm
We serve clients in Louisiana, Texas, Arkansas,
and across the nation.
800-988-7855 toll free | 337-366-9892 call or text
4023 Ambassador Caffery Parkway, Suite 201
Lafayette, Louisiana 70503
We serve as lifelong stewards of our clients’ financial lives helping them protect, grow,
and preserve their wealth with clarity, discipline, and care over a lifetime.
What We Do For Our Clients
We specialize in holistic retirement planning and wealth management by taking a proactive, personal approach with each and every client. As an independent fiduciary family office, we tailor our plans to the needs of you and your family.

Proactive Money Management
We monitor your portfolio daily — so you don’t have to. Smart, math-based investing tailored to your goals with active monitoring and reporting directly to you.
Learn More
At Hux Capital, we take a proactive approach to managing your investments—one that adapts to market conditions rather than reacting to them. We monitor portfolios daily and adjust positions based on in-depth technical, fundamental, and market analytics.
Our priority includes a focus on helping manage your assets against significant loss. We may adjust portfolio allocations, including increasing cash positions, based on market conditions to help manage risk. We actively assess what to hold, what to exit, and where new opportunities may exist across sectors.
Our technology allows you to track your portfolio in real time, receive alerts, and stay informed about your investments. In 2024, AssetLock® was launched, a powerful tool that aligns your investments with your personal risk score and provides ongoing updates tailored to your plan.
We serve as your fiduciary partner, dedicated to proactively managing your financial life.

401(k) Rollover & Management
Whether you’re rolling over an old 401(k) or need help managing a company plan, we’ll build a strategy that works for your goals — and your taxes.
Learn More
401(k) Rollovers
Rolling over an old 401(k)? Don’t leave it behind or risk unnecessary taxes.
We’ll help you structure a strategy for your retirement assets with a tax-efficient rollover strategy that aligns with your long-term goals. Simple, secure, and built around you—not your old employer.
401(k) Company Plan Services
We aim to provide ongoing, hands-on support to your company and your employees—ensuring everyone understands their plan, stays engaged, and gets the guidance they need to make informed retirement decisions.

Retirement Income & Social Security Planning
Turn your savings-and your Social Security into retirement income designed to last with a thoughtful plan that is built with purpose.
Learn More
Retirement Income Solutions
Retirement shouldn’t feel uncertain. We use a widely accepted, customized strategy to help you generate income that lasts your lifetime and your spouse’s.
We divide your assets into clearly defined “buckets” based on your goals, risk tolerance, and tax strategy. This creates a more conservative income stream, helps manage market volatility, and aims to reduce the risk that may affect your future income needs.
We also guide you on when and how to begin Social Security benefits, ensuring it’s coordinated with your overall retirement plan, not left to guesswork.
Because we’re independent fiduciaries, we seek to recommend strategies that align with your best interests. That means our only agenda is yours.

Estate & Legacy Planning
Address concerns with your estate, reduce tax burdens, and pass on your values-not just your assets. Legacy extends from generation to generation and we are here to help you navigate.
Learn More
We help you plan wisely, not just for today, but for generations to come.
Our estate and legacy services go beyond basic documents. Yes, we’ll guide you through essential tools like wills, trusts, and powers of attorney, but we’ll also help you think through how to preserve your values alongside your wealth.
Whether you want to protect assets for your children and grandchildren, support causes you care about, or reduce family conflict down the road, we’ll help you create a plan that reflects what matters most.
This is about more than transferring money. It’s about creating a legacy that lasts.
Life, Long Term Care, & Risk Planning
Protect your family, health, and legacy with smart insurance and long term care strategies tailored to your family's needs. Don't leave this important piece of life to chance.
Learn More
You’ve planned for retirement. But have you planned for the risks that could derail it?
Life insurance and long-term care planning they're appropriate for many families. These tools help protect your assets, your family, and help instill confidence in from life’s unexpected turns.
Many Americans will need long-term care. Without proper planning, rising healthcare costs could significantly impact your retirement savings. We’ll help you explore smart, flexible solutions that can cover care costs while preserving your legacy.
The best time to plan is while you’re still insurable. We’ll guide you through your options so you can act with confidence, not regret.
Holistic Financial Planning
One plan. Every angle covered-investing, protection, income. Working together with you to create a custom evolving plan for you and your family as your needs change over the years.
Learn More
We build customized strategies for your family’s future that emcopasses all of the aspects you will face in retirement.
At Hux Capital, our holistic approach integrates every piece of your financial life: income planning, investments, tax strategies, insurance, estate planning, and legacy goals. Whether you’re just entering retirement or already well into it, we ensure your plan stays aligned with your evolving needs.
But we don’t stop with you. We work with your children and future generations to carry your financial plan forward. Educating, preparing, and empowering them to build on what you’ve started.
This isn’t one-size-fits-all planning. It’s a customized, ongoing relationship focused on build, support, and passing on your assets with purpose.
How You Benefit
At Hux Capital Management, we believe financial advice should be transparent, personal, and focused on your needs. As fiduciaries, we're legally and ethically committed to always striving to do what's best for you-
not for a product or a commission.


Innovation
Appropriate solutions to help our clients aim for their goals.

Fiduciary First
Honesty, integrity, and transparency.

Excellence
Real access to real people.
We are here for you-ready to help.
Frequently Asked Questions
Everything you need to know about the service and billing.
How are you able to monitor accounts on a daily basis?
Thanks to our monitoring software called AssetLock®. Not only are we able to see how your accounts are performing, you will also get performance alerts and updates via email and texts so we are always on the same page.
AssetLock® is tracking software used to monitor the performance of a client’s household portfolio and predetermine the amount of downside the client is willing to tolerate. The AssetLock Threshold is the maximum percentage of the downside the investor is willing to accept inside the portfolio as determined by Simplicity's proprietary risk scoring algorithm, which is based on a Risk Tolerance Questionnaire and Value at Risk (VaR) Analysis of the household and model portfolio(s). It is NOT an actual stop order and will NOT automatically sell the individual securities in the household portfolio.
What platform do you use to manage accounts?
We utilize Charles Schwab and Fidelity as our trading and monitoring platforms for managed accounts. Clients are able to access our Client Portal and log in to their accounts anytime.
What kinds of accounts and products do you typically use for retirement planning?
As fiduciaries, we consider your entire portfolio when created personalized plans. Different plans contain different accounts and products and no two are the same.
We manage and guide your investments within a wide range of account types including:
+ Company 401(k) Plans
+ IRA (Traditional, Inherited, Roth, Simple)
+ Individual and Joint Investment Accounts
+ Long Term Care Policies
+ Life Insurance (Term, Whole, IUL, & LTC Hybrids)
+ Fixed Indexed Annuities
+ Fixed Rate Annuities
+ Multi-Year Guaranteed Annuities
Headquartered in Lafayette, Louisiana
We serve clients nearby in Louisiana, Texas, Arkansas, and beyond across the nation.
The interest credited is limited by either placing a cap on the amount of interest that can be earned (“cap” rate) and/or requiring a specified rate that must be surpassed within the index before interest will be credited (“spread rate”). The interest credited on your contract may be affected by the performance of an external index. However, your contract does not directly participate in the index or any equity or fixed interest investments. You are not buying shares in an index. The index value does not include the dividends paid on equity investments underlying the equity index or the interest paid on any fixed income investments underlying any bond index. These dividends and interest are not reflected in the interest credited to your contract.
TESTIMONIALS
Reviews are from Google and may not represent all client experiences. No compensation was provided. Past experiences are not indicative of future results. Investment advisory services offered through Simplicity Wealth, LLC, an SEC-registered investment adviser. Insurance and education services offered through Hux Capital Management, a separate and unaffiliated entity.
Latest from Our Blog
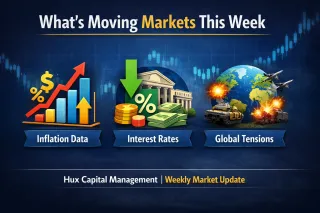
Weekly Market Update: Markets Rebound, But Inflation and Global Tensions Keep Investors on Edge - April 6, 2026
Markets rebounded last week, but inflation data, interest rates, and global tensions are keeping investors cautious. Here’s what to watch now. ...more
Management ,Retirement Market Investing Finance &Insights
April 08, 2026•3 min read

Weekly Market Update: Inflation, Energy, and Investor Sentiment Collide - March 30, 2026
Markets are navigating rising inflation, energy shocks, and increased volatility. Here’s what’s driving recent movement and what to watch next. ...more
Management ,Retirement Market Investing Finance &Insights
March 30, 2026•3 min read
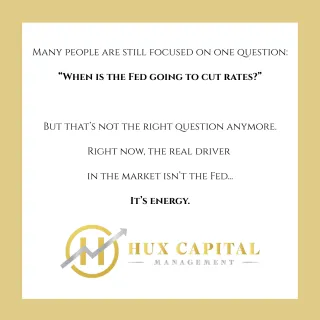
Weekly Market Update: What Actually Matters Right Now - March 23, 2026
Stock market outlook 2026: Energy prices, inflation, and Federal Reserve policy are reshaping markets. Discover how sector rotation is impacting investments right now. ...more
Management ,Retirement Market Investing Finance &Insights
March 24, 2026•4 min read
No blogs found
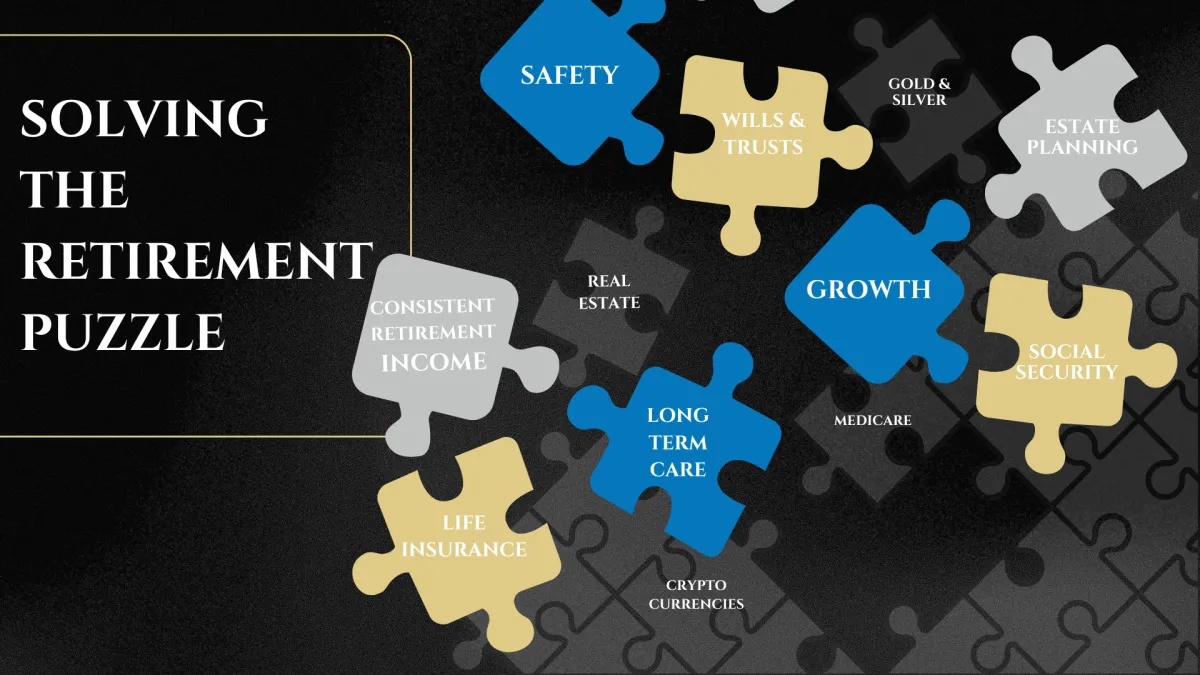
Helping You Solve Your Retirement Puzzle
We understand that retirement is not just about investing.
So much goes into creating a full plan so you are prepared for whatever retirement throws your way.
We are here to help you put the pieces together.
Investment advisory and financial planning services are offered through Simplicity Wealth, LLC, an SEC-registered investment adviser. SEC registration does not constitute an endorsement of the firm nor does it indicate that the adviser has attained a particular level of skill or ability. Insurance, Consulting and Education services offered through Hux Capital Management is a separate and unaffiliated entity from Simplicity Wealth.
The presence of this website shall in no way be construed or interpreted as a solicitation to sell or offer to sell investment advisory services to any residents of any state other than where legally permitted. All written content is for information purposes only. It is not intended to provide any tax or legal advice or provide the basis for any financial decisions.
Hux Capital Management, LLC and Randy Hux are not affiliated with or endorsed by the Social Security Administration or any government agency.
Images and photographs are included for the sole purpose of visually enhancing the website. They should not be construed as an endorsement or testimonial from any of the persons in the photograph.
The information being provided is strictly as a courtesy. When you link to any of the websites provided here, you are leaving this website. We make no representation as to the completeness or accuracy of information provided at these websites. Nor is the company liable for any direct or indirect technical or system issues or any consequences arising out of your access to or your use of third-party technologies, websites, information and programs.
COMPANY
CUSTOMER CARE
LEGAL
We are a 1776 company—independent, principled, and committed to doing what’s right for our clients.